

Trump 2.0 and Solar’s Middle Market
How will GOP leadership of the legislature and the White House impact solar’s middle market in the US?
Leading up to the 2024 presidential election, a GOP sweep of the presidency, house, and senate seemed like a worst case scenario for the US solar industry. Control of the legislative and executive branches would give Republicans an opportunity to use legislative measures as well as executive actions to roll back progress on renewables, including Biden's signature Inflation Reduction Act. And, with Trump in the White House again, who knows what chaos might ensue?
Now that this scenario has come to pass, it’s worth taking stock of how the election results are likely to affect solar’s middle market. We’ve previously covered the impacts of the IRA, the non-linear benefits of ITC percentages on project values, and the impacts of ITC transferability on the market. This legislation has supercharged solar’s middle market over the last two years and is the first focus of our attention here.
Reasons to be Optimistic
The key to keeping the Inflation Reduction Act intact, or at least the core provisions accelerating solar’s middle market, is the House of Representatives. House Speaker Mike Johnson has said that it would be impossible to repeal the full IRA, and the only way to change it is with “a scalpel and not a sledgehammer”. 18 of his House GOP colleagues have urged for this publicly, and many others have in private as well. SEIA and industry leaders have indicated that there is no political appetite for a full repeal.
A big reason for bipartisan support for the IRA comes from its broad distribution of benefits across the country. The following chart illustrates how more solar capacity has been added in counties that voted for Trump than in counties that voted for Biden.
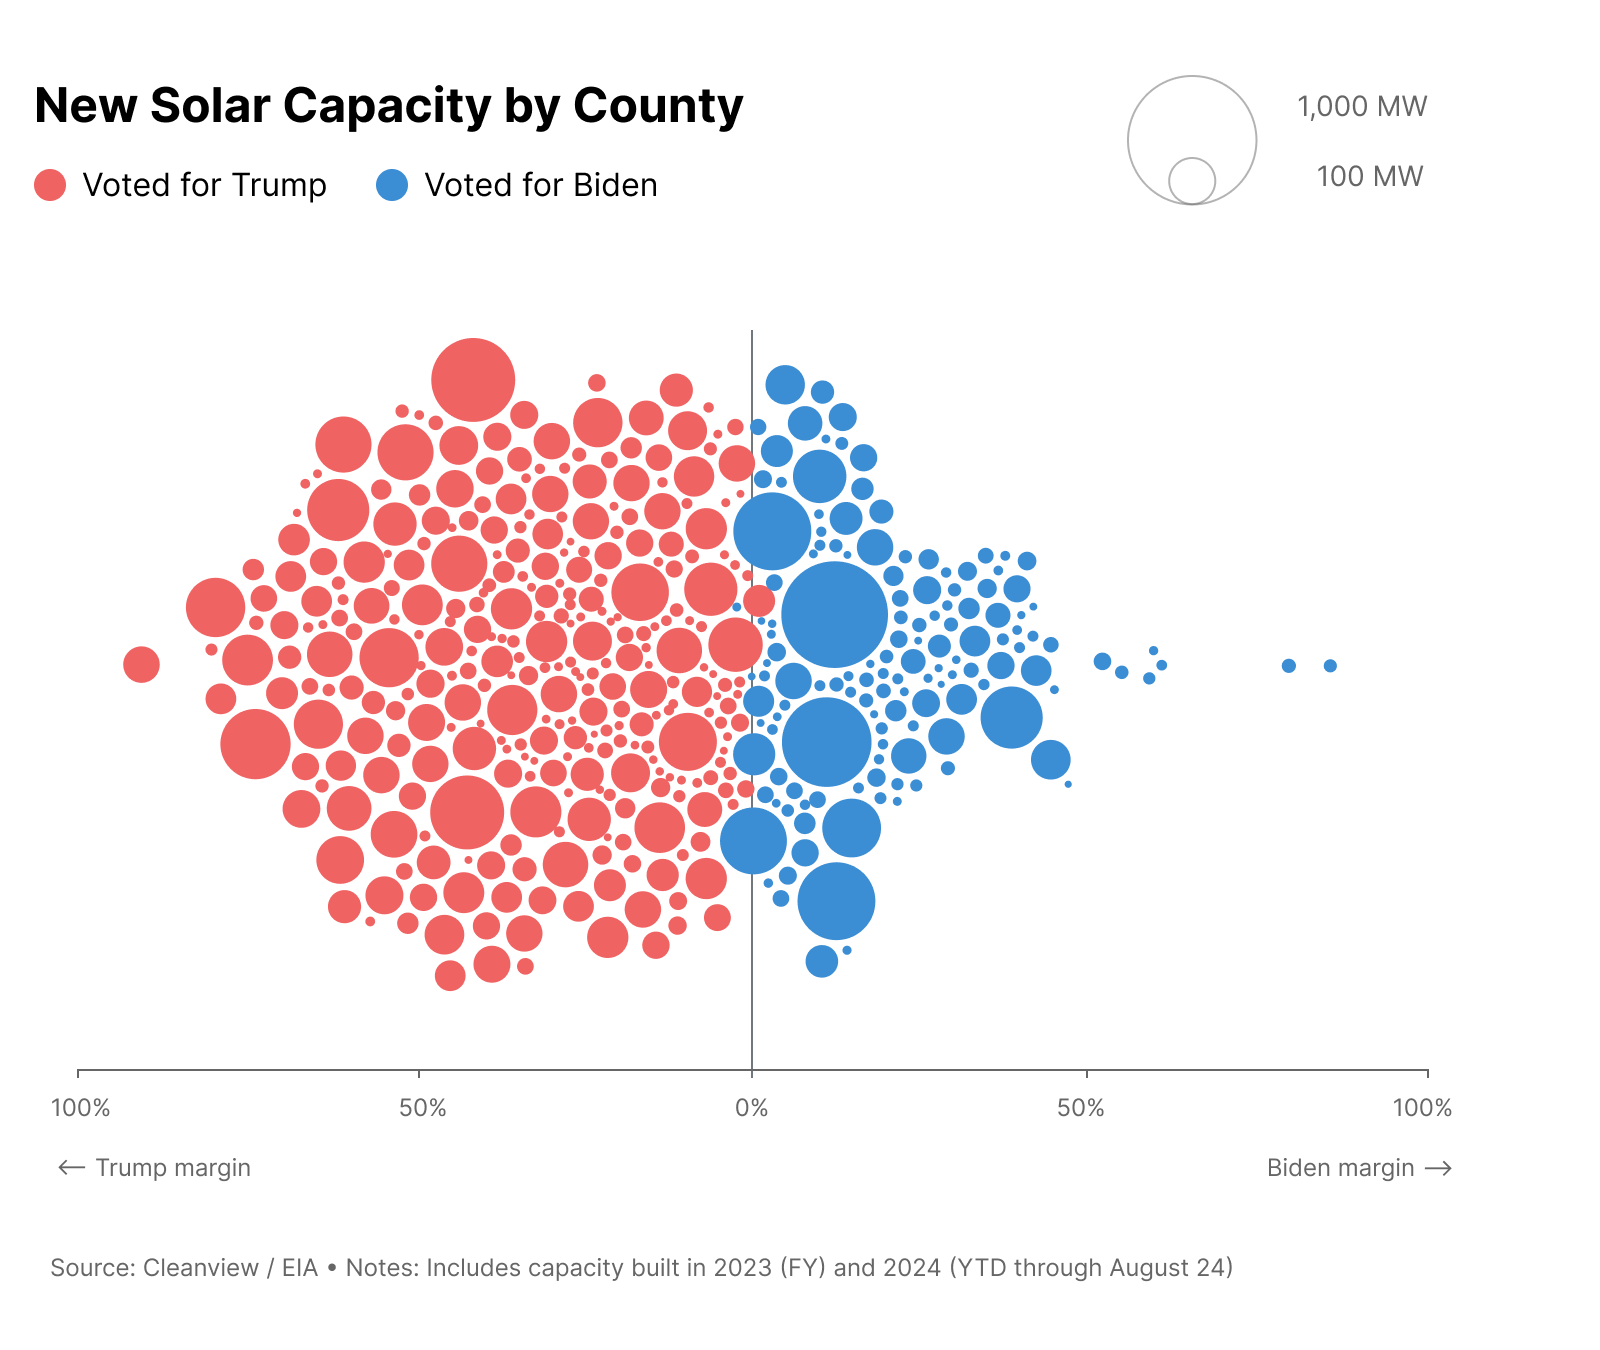
Historically, once a government program benefits certain constituencies it becomes very hard for Congress to take it away - especially when the constituency is broad and bipartisan. So there is good reason to be optimistic about the general stability of the Investment Tax Credit for solar projects.
Areas of Concern for the ITC
This all of course begs the question of what a “scalpel” would cut, and which parts of the IRA are most likely on the chopping block. Some of the top candidates for cuts do not affect solar’s middle market. These include EV tax credits and off-shore wind. Others would only impact specific types of projects in the middle market. These include the ITC adders for Low-to-Moderate Income communities and the direct pay or elective pay option for non-profit organizations.
The concept of Domestic Content aligns with GOP goals for US manufacturing, but it may become a requirement for the base 30% ITC on all projects instead of a bonus 10% adder to the tax credit. That would add costs for all projects while removing additional benefits for domestic components. We have not yet seen the Energy Communities adder considered as a priority for modification.
A greater long term risk to the middle market is the potential for an earlier phase-down of the tax credits, even as soon as 2027 or 2028. There are active discussions about this kind of timeline among the incoming administration. But it’s worth noting that such drastic changes have not passed congress, and seem rather heavy handed for a “scalpel” approach. If they are included, changes to the phase-down timeline may have the greatest impact on solar’s middle market in the long term.
The good news is that we may know how the IRA will change under Trump as soon as Q2 of 2025. Because of the way that the IRA was created, it can be modified through a budget reconciliation process. And this is likely to happen as part of a Republican effort to help pay for the extension of tax breaks from Trump’s first term, which are set to expire in 2025. Such a tax bill is part of a still broader Republican legislative agenda which faces considerable obstacles with a very slim house majority.
Other Areas of Concern
There will be tariffs on imports. And these do not require legislative changes and the approval of congressional representatives from the districts in the chart above. Despite a growing domestic manufacturing base, the US solar industry still imports most of its solar panels and inverters and will almost certainly be heavily hit by Trump’s tariffs, again.
The good news for the middle market is that distributed energy generation is much less impacted by tariffs than utility scale developments where the equipment makes up a larger share of project budgets. Tariffs will squeeze project economics across the board, but they are much more likely to make Gigawatt scale projects uneconomical than C&I, community solar, and small utility projects.
Grant programs are also candidates for the chopping block. And Trump will have broad authority to change political appointments at DOE and FERC. So forward-looking programs that support innovation and efforts at interconnection reform will likely be impacted, and may be stalled or derailed.
The Big Unknown
The biggest impact of a second Trump administration may come in the form of general uncertainty. This is terrible for business, especially in an industry built on long-term contracts. Despite the challenging changes ahead, we’ve heard a strong desire to get through them quickly so that we can once again know what we’re working with. Uncertainty can stall decision making, create delays, and sap momentum.
In his time away from the White House, Trump seems only to have enhanced his reputation as an agent for chaos. And he’s promising to deliver it in full force. So the biggest impact of Trump 2.0 may be what Donald Rumsfeld famously termed "unknown unknowns”.
How the Market is Reacting
So far, we’ve seen full steam ahead on deals in progress and strong interest in new deals on the horizon. The consensus is that good projects are likely to move forward, perhaps with some repricing and adjustments to accommodate legislative changes. This reflects industry optimism about the strength of the ITC and its broad support in the House of Representatives.
Reactions We’re Anticipating
In past rides on the solar coaster, we’ve seen accelerated market activity just prior to adverse policy or incentive changes followed by a slower period. Examples include previous ITC phase outs and the end of NEM 2.0 in California. We’re anticipating a similar pattern in the next few years, with its severity and timing determined largely by the extent of Republican trimming on the IRA. We could face a slower pace of growth for a spell, a plateau followed by more growth, or a temporary contraction.
None of these patterns will alter the fundamental trajectory of solar energy. But they will impact near and medium term market dynamics. If projects find themselves in need of new financing partners during these turbulent times, we’ll be here to help.
Concluding Thoughts
Despite some very good reasons to be optimistic about core policies supporting the US middle market, these are difficult developments. As of yet, we are not anticipating positives for the solar industry from GOP leadership. The conversation is all about anticipating the extent of the damage. Uncertainty makes these predictions especially difficult, but we’ve done our best to read the tea leaves here. And while we would prefer not to give Trump any more of the attention he seems to crave, it’s also important occasionally to address the elephant in the room.

Insights from RE+ Las Vegas
What a week! Marc and I attended RE+ in Las Vegas last week, and it was bumpin’. Last year the conference had 27,000 attendees and this year had more - we heard estimates between 35,000 and 50,000, with 40,000 as the most common. Wherever the official number lands, it felt massive.
The Venetian Convention and Expo Center is so big that it can take 10 minutes to walk from one end to the other - assuming that you know where you’re going. But the place is a warren, and some people didn’t have cell phone reception. Our hit rate on back-to-back meetings was about 70% - not bad, actually. Lucky for us, our hotel didn’t get hacked. Not so lucky for some of our friends, and not the kind of luck you want to try in Vegas.
Industry Growth
It was a great year to be at the conference. The solar industry is growing rapidly spurred on by the Inflation Reduction Act. EPCs, developers, and investors are busy with deals in process and big plans for 2024 and 2025.
That growth is exciting but it comes with some challenges. Every company we spoke with is at or very near its maximum capacity. Developers are pushing forward on many projects all at once. Investors are financing these while also raising their next rounds of funding. We’re particularly attuned to a few late-stage project acquisitions targeting COD in Q4 - very important for all parties to align on these timelines.
Industry momentum is palpable, with deal activity and record breaking forecasts. One of the few places with a different near-term trend is behind-the-meter projects in California, where NEM 3.0 has put the brakes on solar-only projects and supercharged storage solutions. We’re excited for the long-term there too.
ITC Transfers
We’re hearing consistent themes on ITC transfers as as we get ready to enable these transfers in the marketplace in Q4:
Everyone is excited for transfers to happen
There’s lots of deals in flight but very few will close in 2023
Most deals are supported by insurance
Partial transfers are common, particularly with larger projects
With the IRS registry not anticipated to launch until December, it’s no surprise that quite a few buyers and sellers are waiting until 2024 to jump in. The proposed guidance released in June has helped, but it hasn’t resolved every issue. The most buzz about a potential variance from that June guidance is focused on the possibility that the IRS might allow purchased credits to offset active income. This would unlock a whole new set of buyers. But it would be a drastic change and it seems unlikely at this point.
Other RE+ Musings
Along with all the productivity came some great moments shared with friends. Here’s a sampling of what went down behind the scenes:
Our most common meeting spots were not in the Expo hall; they were scattered throughout the resort. One was a giant “Love” sign in front of an atrium waterfall. Another was an indoor replica of an open-air market beside a river with gondola rides. It almost felt like getting outside.
One of our partners lost his shoe. It literally disintegrated under his foot while we were meeting with him just steps away from a shoe store with fine Italian leather. Do resorts plan these things?
We found the perfect remedy for the desert heat: an ice bar! It is a bar within a freezer with glasses made out of ice. They give you coats and gloves to borrow so that your glass can melt right through your gloves and freeze your hands. All of a sudden that desert heat was sounding pretty good again.
We heard some great stories from Solar Fight Night, but this event continues to elude us. For general awareness, 10pm-2am Pacific Time is 1am-5am Eastern Time. Hats off to all East Coast attendees who made that one!
Marc, our CEO, got lost in the expo hall for 20 minutes trying to find the exit. When he finally emerged he had scored a teddy bear, heard a mariachi band, and been offered about 34 different beverages along the way.
Next year is back in Anaheim and we’ll see everyone back at the Venetian for RE+ 2025. We’ll set the over/under on attendance there at 60,000. Book your rooms soon!
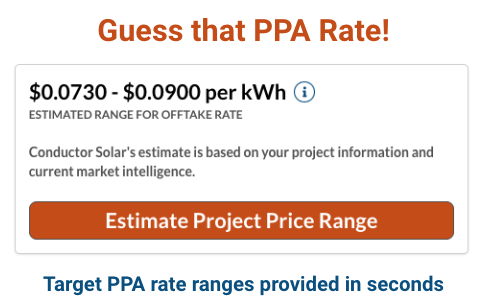
Guess that PPA rate! Key pricing variables in solar deals
We've found that experienced developers can get pretty good at anticipating PPA rates for their customers. They know the avoided cost of power, their cost to build, and the approximate production yield in their target geography. But when they step out of their sweet spot, their ability to predict a PPA rate goes a bit haywire!
We introduced a new game this year at the NABCEP conference: “Guess that PPA Rate!” Players rolled a dice three times to determine system size, production factor, and build cost for a mid market PV system. Then we asked them to guess the associated PPA rate.
It was not easy! We did have a few players guess a rate in the proper price range, but the vast majority were well outside of the targeted range.
The engine behind this game is our auto pricing tool. For every scenario, Conductor ran a financial model in seconds. We took these three basic inputs:

And these generated PPA rates between $0.037 and $0.256 per kWh. To make this game work, we held constant a number of other variables which we’ll outline below. But the variety generated with just these three variables was enough to challenge some of the most experienced people in the solar industry. Why is this?
We sometimes get asked where PPA rates are at the moment, as if we could just quote them like interest rates at a bank. But mid market PPAs don’t work that way. Rates are different for every project, and we see viable projects priced at both ends of the rate range above. Furthermore, most people in the solar industry are really familiar with only one part of the market. It’s almost like you need a computer to answer this question for any given deal.
Bingo. That’s why we created auto pricing. The following are key variables that tend to have the biggest impact on PPA rates:
System size
Production factor
Build cost
PPA term length
PPA escalation rate
Federal ITC %
REC ownership and value
Upfront incentives
Site lease cost
Property taxes
O&M cost
Insurance cost
Development status
Our model uses these and other inputs to generate an expected rate range for a project’s PPA. We can run it in reverse to generate a build cost or budget based on an offtake rate, and we can model leases and ESAs in addition to PPAs. But it’s fairly complex, and way more accurate than guessing by humans - even us.
Each variable impacts PPA pricing to different degrees. But we can group them by category and identify which way a PPA rate moves when a particular variable increases:

To be clear, the PPA rate we’re talking about here is the initial rate paid by the customer in the first year of system operation. Longer term lengths and higher escalation rates in the agreement lower this initial rate in year 1. In most cases, PPAs need to deliver customer savings of at least 10% in the first year. When this doesn’t happen, it’s hard for PPAs to work. So this evaluation is useful for finding out whether or not a PPA is really an option for a particular customer.
At a conceptual level, the table above summarizes how auto pricing works and how investor pricing works more generally. You need inputs for all of these variables, or at least reasonable assumptions, to estimate what a customer’s PPA rate will be. Our tool is designed to predict the pricing from investors who are the best fit for a particular project. That’s important, because the best fit for a 300 kW deal is often different from a 1 MW or a 5 MW deal.
One of the things that we enjoy at Conductor is helping developers and EPCs succeed with new types of projects. Part of this is finding the right financing partner, but part of it is also working through pricing scenarios to make the project economics work. If a deal doesn’t work with a 20-year PPA at a 1% escalator, how about a 25-year PPA with a 1.5% escalator? We help developers and EPCs hone in on the terms that will maximize their chances of success in achieving the customers’ objectives and their goals as a company.
In the next post, we’ll outline a step-by-step approach for pricing customer PPAs. It’s a way for C&I developers and EPCs to present customers with third party ownership options alongside cash purchase and loan options - even very early in the sales process. We help sales teams do this with confidence, supported by the accuracy of auto pricing and the investor bids that inform it.
Challenges in the Middle Market
We often talk about solar energy’s “middle market” as the segment sandwiched between residential and utility scale projects. In the past it has been referred to as “commercial”, “C&I”, “commercial and community”, and our all-time favorite “non-residential”. It’s a segment so underserved that it hasn’t even had a good name.
The middle market is full of potential but held back by unique challenges. Historically, its growth rate has been less than half of the residential and utility segments. And despite growth across all segments, the middle market’s share of the US market has declined from about a third ten years ago to about a tenth today.

What is holding the middle market back? A comparison of key project characteristics across market segments offers some clues:

Challenges in the Middle Market…
Site types and project sizes include some added variety in the middle market, but a big difference is the diversity of offtake types and the lack of a consistent credit rating and underwriting methodology. More broadly, the residential segment benefits from standardization and repeatable business practices while the utility segment benefits from greater economies of scale.
Residential projects are numerous, and if you can’t figure out a way to do them over and over in a similar way it’s hard to scale a business. With PPAs, this has meant standardized documents that are basically take-it-or-leave-it contracts for homeowners. Imagine lawyers at a residential financing company going back and forth with every homeowner over red lines in their PPA agreements. Not going to happen.
Utility projects can afford bespoke contracts. Key agreements go through multiple iterations, and there are about a dozen really important ones in each deal. The costs of legal and technical experts add up, but they’re borne by the overall project. With budgets in the hundreds of millions or even billions, these costs are absorbed as a smaller percentage of the budget.
By contrast, middle market projects don’t have a consistent approach to soft cost management. They lack the standardization of residential projects and the scale of utility projects. By some estimates, the percentage of soft costs in their budgets mirrors those in residential solar, despite project sizes 25x greater!

…And Opportunity
Our goal is to unlock the middle market. And we’re very excited about what it can become. Wood Mackenzie has estimated that the US is sitting on 145 GW of unused commercial solar potential. And that figure doesn’t include the potential for ground mounts, either located on-site with a customer or for community solar projects.
There is a lot of work to be done to realize this. In future posts, we’ll look at additional opportunities and challenges specific to this market segment. To lay the groundwork for this, we wanted to start by contrasting the middle market with the segments on either side. Our team’s experience across all three made for some lively conversations. If you’ve worked across these market segments, let us know what you think!
Electricity Rate Impacts on Solar Economics
In recent posts, we’ve highlighted a number of big changes affecting solar energy’s middle market. From the IRA’s impact on the ITC (growth spiral, transfers and direct pay) to NEM 3.0 in CA, and tariff cases, we’re seeing a lot of big policy shifts for the industry. But something else is changing too, which could be even more important over the long-term.
In this post, we highlight how electric rates impact customer savings, and why these changes are so significant for the middle market:
Rates are spiking all over the country, with double-digit growth not seen in many years
This makes solar energy more attractive, by increasing the savings it provides relative to electricity from the grid
Uncertainty about future electric rates elevates customer interest in solar energy’s price stability and predictability
Trends in Electricity Prices
After a decade of relatively stable electric rates characterized by modest single-digit price growth, electricity prices have shot up dramatically. Nationally the 14.1% annual increase in retail electricity prices is almost double the 7.7% general price inflation in the CPI data. And it’s not just one sector or a few regions driving this spike. According to the latest EIA data, double-digit price increases are happening all over the country:
Across all three sectors (residential, commercial, and industrial)
In 8 out of 10 regions of the country
In a majority of states (35 in residential, 30 in commercial, and 40 in industrial)
But that’s just the double digits. Electricity prices are increasing almost everywhere at much higher rates. The following chart highlights this spike for commercial customers in the context of the last 10 years.

Short-Term vs. Long-Term Price Drivers
Factors that impact electric rates are numerous and complex and vary in significance from one region to another. We’re not going to tackle this in detail. But a useful way to think about it is in two categories that align with key items on an electric bill: supply and delivery.
Utilities generate electricity or buy it from independent power producers. Big purchases of electricity happen on the wholesale market, where supply and demand vary and prices change from moment to moment.
For example, if extreme weather events cause consumers to crank up their air conditioning, electricity demand spikes and pushes up wholesale prices. Weather can impact the supply of solar and wind power, and over time even hydropower. Fluctuations in fuel prices impact other generation sources, like natural gas turbines. Sometimes we see these impacts in the form of surcharges, like the $0.06 / kWh Power Supply Cost Recovery charge currently on Consumers Energy bills in Michigan.
The other category is delivery charges, which cover the cost of electricity transmission and distribution through the grid to a customer’s property. These are typically impacted by longer term investments in grid infrastructure paid for over many years. When the grid needs major upgrades, for example to reduce the risk of wildfires or to accommodate more demand or a new source of supply, then delivery charges will go up. But they tend to increase more gradually, and without temporary surcharges.
For all rate increases, electric utilities need regulatory approval to pass additional costs on to customers. Approvals take time, and the changes are often designed to be gradual. So for many customers, recent spikes in electric rates are just the first of more price increases to come over the next few years.
Impact on Customer Savings
For the customer, solar energy is an alternative to energy from the grid. Whether the customer is a business offsetting power with a system on their roof or someone buying community solar from an array in their area, they’re inevitably comparing the price of solar to their utility rate. And the higher utility rates go, the more customers save with solar.

The chart above compares a customer’s solar PPA rate with the electric rate from their utility under two scenarios:
The utility rate (ACP, “Avoided Cost of Power”) grows at 3% and at 6% per year
The PPA rate grows at 1.5% per year, a typical escalator for a commercial solar PPA
The customer’s initial PPA rate is set at a 10% discount to ACP, with ACP starting at 10 cents per kWh and the PPA rate at 9 cents per kWh
The timeline on the x-axis is 25 years, which aligns with most solar panel warranties and many PPA term lengths
Over 25 years, the PPA’s discount grows from 10% to 37% when electric rates grow at 3% annually and from 10% to 68% (!) when electric rates grow at 6% annually.
The ACP escalators in this graph are modest compared to the spikes we’ve seen over the last year. This seems reasonable, since we don’t expect double digit price growth to continue for decades. But it does raise the question of which scenario is more likely: 3% annual increases in line with the last few decades, or 6% annual increases that might include periods like the one we’re in right now.
This kind of uncertainty is another reason that customers are attracted to the stability of a solar PPA or solar system ownership. Many see their electric bills going up and realize that they can lock in a lower rate with solar. And while initial bill savings are a great incentive for customers, and a requirement for most commercial solar PPA agreements, the biggest financial benefit may be in future years as utility rates continue to rise.
At Conductor Solar, we help developers working in solar energy’s middle market find high quality investor partners. We see a lot of financial models for solar projects, so many that we built an automated tool to price PPAs and leases. One of the biggest factors that determines whether or not a PPA project will work is the customer’s ACP. So, in addition to piquing customer interest, we expect the recent rate spike to improve the economics of solar projects and help get more commercial and community solar built across the country.